Analytics
The Analytics section of the CMS provides you with an overall insight into the performance of your Stories on the app over your selected date range.
Key performance metrics are presented across six tabs:
Page Views - The number of Pages viewed by users
Viewers - The number of unique users who viewed your Stories
Shares - The number of times users tapped the Share button on a Page
Swipe Ups - The number of times users swiped up on a Page to access a URL
Votes - The number of times users voted in a Poll
Answers - The number of times users answered a question in a Trivia Quiz
These charts allow you to quickly analyze any peaks and troughs in these metrics over the week. Hover over each data point in the chart to view the totals per day. You can also view the totals per hour when viewing metrics for the past day. This can help you identify the most popular time periods for your users and at what time you will get the most engagement.
The total number of Page Views, Viewers, Shares and Swipe Ups across the selected date range are presented above the chart. These metrics are updated on an hourly basis.
Group by Story
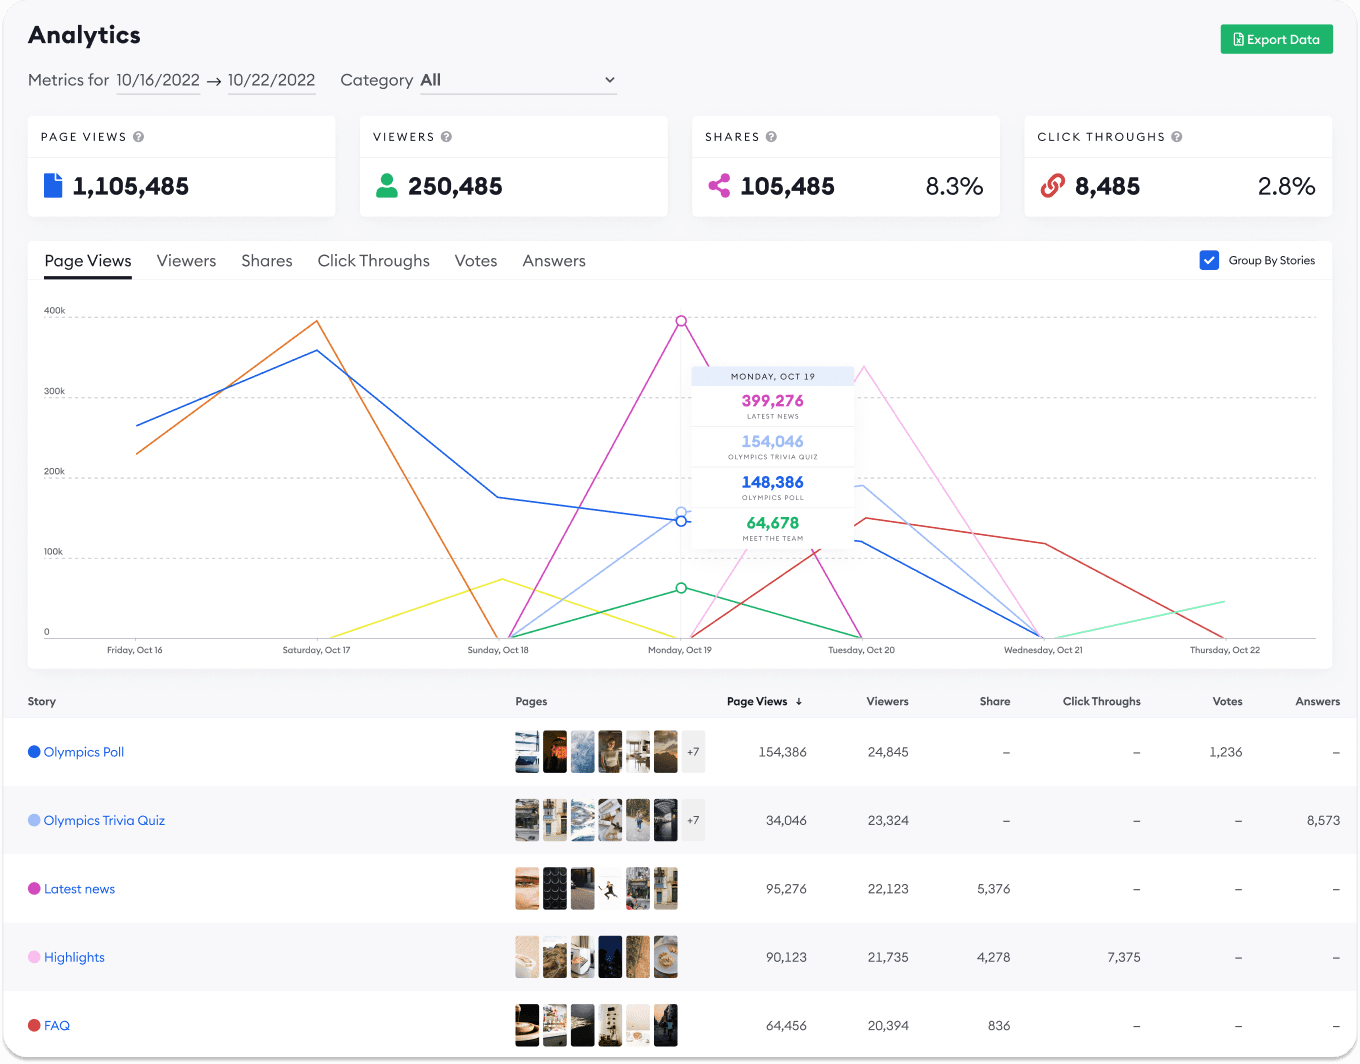
You can choose to group the data by Story by checking "Group By Story". In this view, each Story has it's own line on the chart so you can directly compare the performance of different Stories. This can help to serve as a starting point for determining why some Stories may perform better than others, and what content your users are most engaged with across a given time period.
Below the graph is a table of Stories showing the following information about each Story:
Story Title
Page previews
Page views
Viewers
Shares
Swipe Ups
Votes
Answers
Export
You can export the data from your selected reporting period at any time by selecting "Export Data" at the top of the Analytics section. This will download an .xlsx excel worksheet containing the corresponding data for you to perform further analysis on.
Go to the top