Trivia Quiz Analytics
Within the Engagement Units section of the CMS, you can also access analytics to review the performance of each Trivia Quiz in your app.
To access the analytics, simply click the Edit button or the Title of the Trivia Quiz Engagement Unit you want to review, and navigate to the 'Analytics' tab. This will open the 'Analytics View' for that Trivia Quiz.
Performance Overview
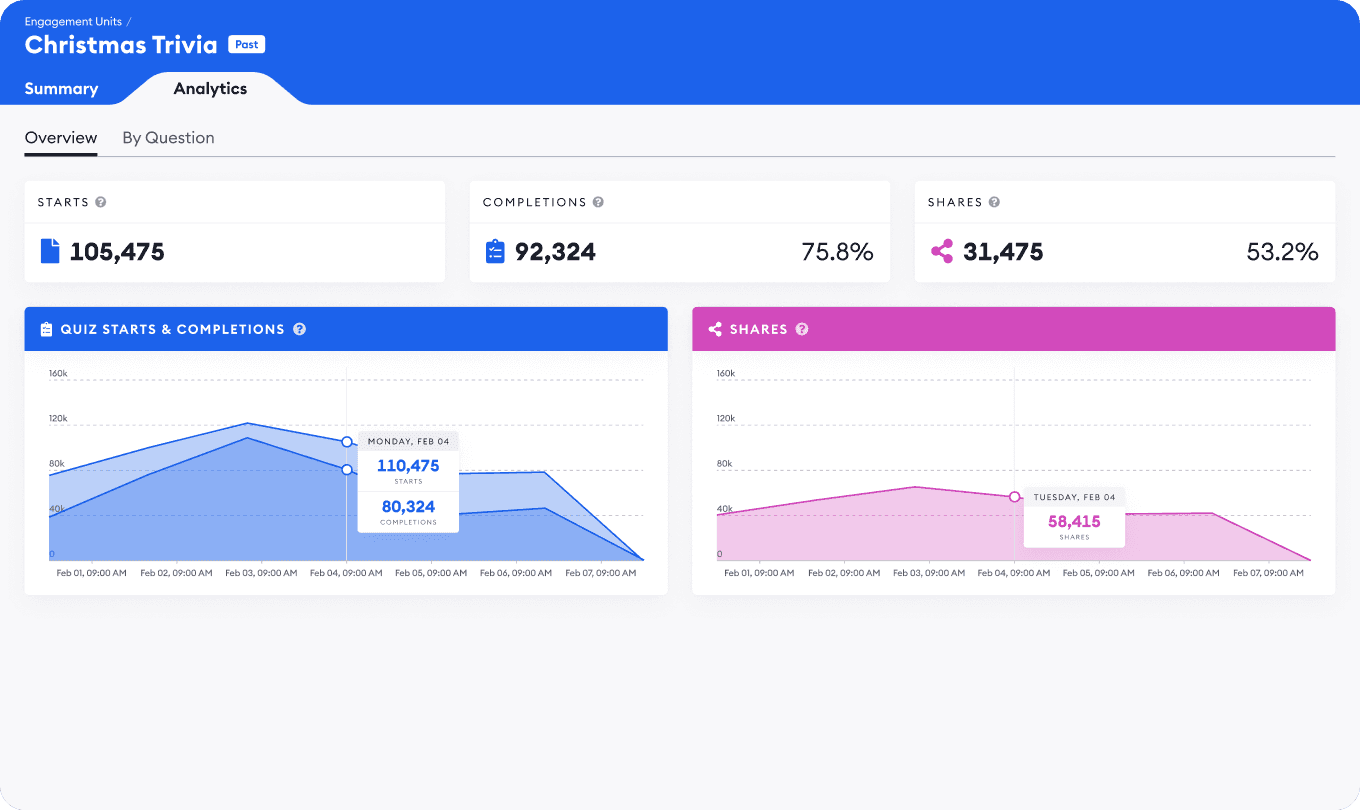
In the Analytics View, you can view a breakdown of key performance metrics for the Trivia Quiz.
The following metrics are shown and represented:
Quiz Starts - The total number of users who have viewed the first Question
Quiz Completions - The total number of users who have answered all of the Questions in the Trivia Quiz. The percentage is calculated as Completions divided by Starts multiplied by 100.
Shares - The total number of users who have tapped to Share their result. The percentage is calculated as Share Taps divided by Starts multiplied by 100.
By Question Overview
The 'By Question' tab in the Analytics View gives you insight into the performance of each individual Question in the Trivia Quiz.
The total number of Views, Shares, Total Answers and Correct Answers (if applicable) are given for each Question over the lifetime of the Quiz. The percentage of total viewers who shared or answered correctly on each Question is also displayed, where applicable.
In addition to these key metrics, a Retention chart illustrates users' engagement with the Trivia Quiz by showing the level of drop off at each Question within the Trivia Quiz.
A preview of the Quiz is provided alongside the Page data so that you can analyze the performance in relation to the content of each Question.

Go to the top